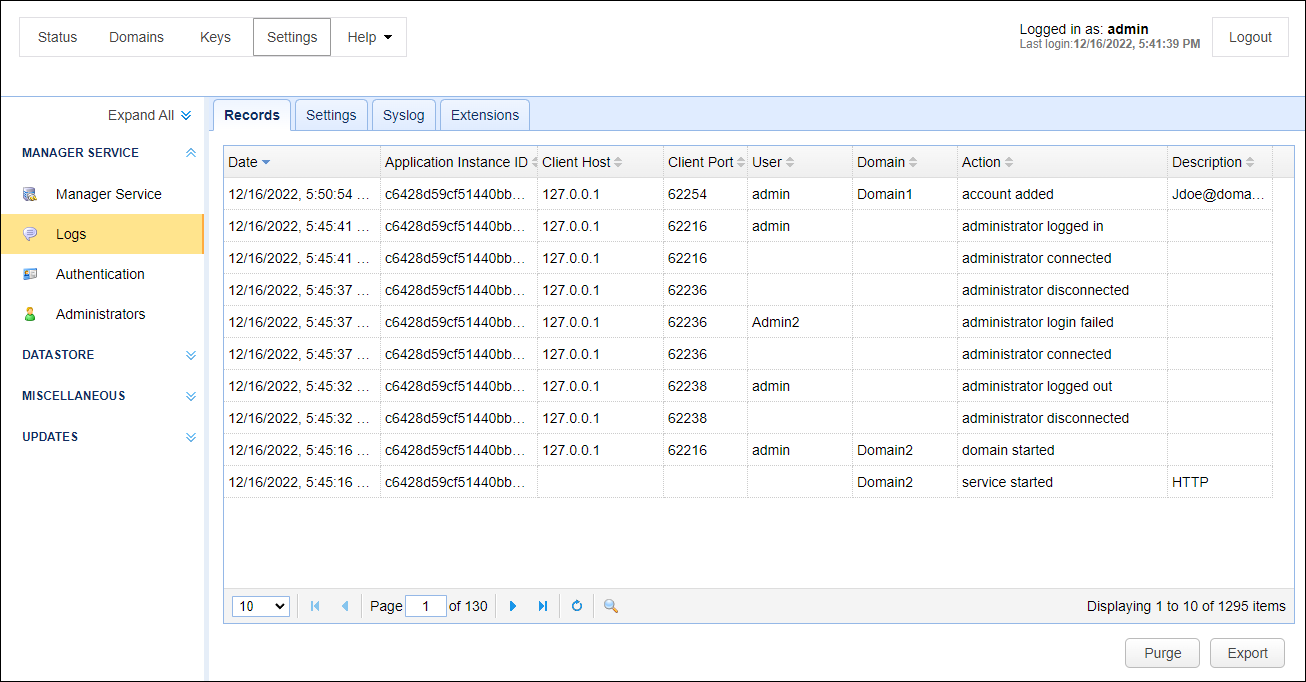
The Settings > MANAGER SERVICE > Logs module provides you with administrative logs in the Records grid, and allows you to optionally log the same data to a Syslog service and/or Extensions, where the current Extension supported is the Splunk HTTP Event Collector.
Administrative logs are stored separately from user log data and are used to track all administrative logins and changes to configuration data. For example, in the figure below, some actions include adding a new user account (account added), administrative success or failure logins, and the starting of Domain2.
Figure 196

Records
Date - The date/time the action occurred.
Application Instance ID - The application instance ID that handled the request. This ID uniquely identifies a particular MFT Server instance and can help administrators distinguish between nodes in a multi-node HA cluster. If this MFT Server instance is not part of a HA cluster, then this value will always be the Application Instance ID of this instance.
Client Host - The client IP address of the administrator.
Client Port - The client port of the administrator.
User - The user login of the administrator.
Domain - The domain affected by this change.
Action - The action that occurred.
Description - A description of the action that occurred.
Purge - Performs a purge of all administrative records.
Export - Exports all administrative records to a CSV file.
Settings
Clear records older than N days - If enabled log records older than N days will be automatically purged from database.
Syslog
Enable syslog - When checked, MFT Server sends administrative logs to a syslog service
Host - The IP address of syslog daemon.
Port - The port of syslog daemon.
Facility - The syslog facility to use.
Process name - The syslog process name.
Extensions
Log to Splunk HTTP Event Collector. When checked, MFT Server sends administrative logging data to a Splunk HTTP Event Collector (HEC). To use this option you must have a Splunk HEC installation. This feature works in addition to existing administrative logging and the syslog service, if enabled (Settings > MANAGER SERVICE > Logs > Syslog).
Host - The IP or hostname of the Splunk Enterprise or Splunk Cloud Platform server.
Port - The port of the Splunk deployment. The default is 8088.
Timeout - The connection timeout, in seconds. The default is 30.
Access token - The token that is used by the MFT Server to authenticate the connection to Splunk HEC. Your Splunk administrator or a designated token administrator should generate and provide you with a valid token.
Source - The source value to assign to the event data. This typically identifies the application where the data is coming from (e.g. MFT Server).
Source Type - The source type value to assign to the event data. This typically identifies the type of data coming from the source. (e.g. Administrative logs).
Use SSL Connection - When checked, an SSL connection is used to connect to the Splunk deployment.
Index - The name of the Splunk index.
Test Parameters - Click on this button to test the connection from the MFT Server to the Splunk deployment.
Note: If a failure occurs in logging the data to the Splunk HEC, you can be alerted about this condition using a Trigger with an Event type of Log Extension Failure.